OpenAI Agents SDK Audit Logs Need a Trace Export Acceptance Test

The OpenAI Agents SDK traces agent runs, model generations, function calls, guardrails, handoffs, and audio operations by default. Those spans are useful diagnostic evidence, but their value depends on sensitive-data settings, exporter composition, buffer delivery, identity binding, and custody. This guide turns SDK tracing into a release acceptance test and keeps organization audit events separate from routed model-request policy records.
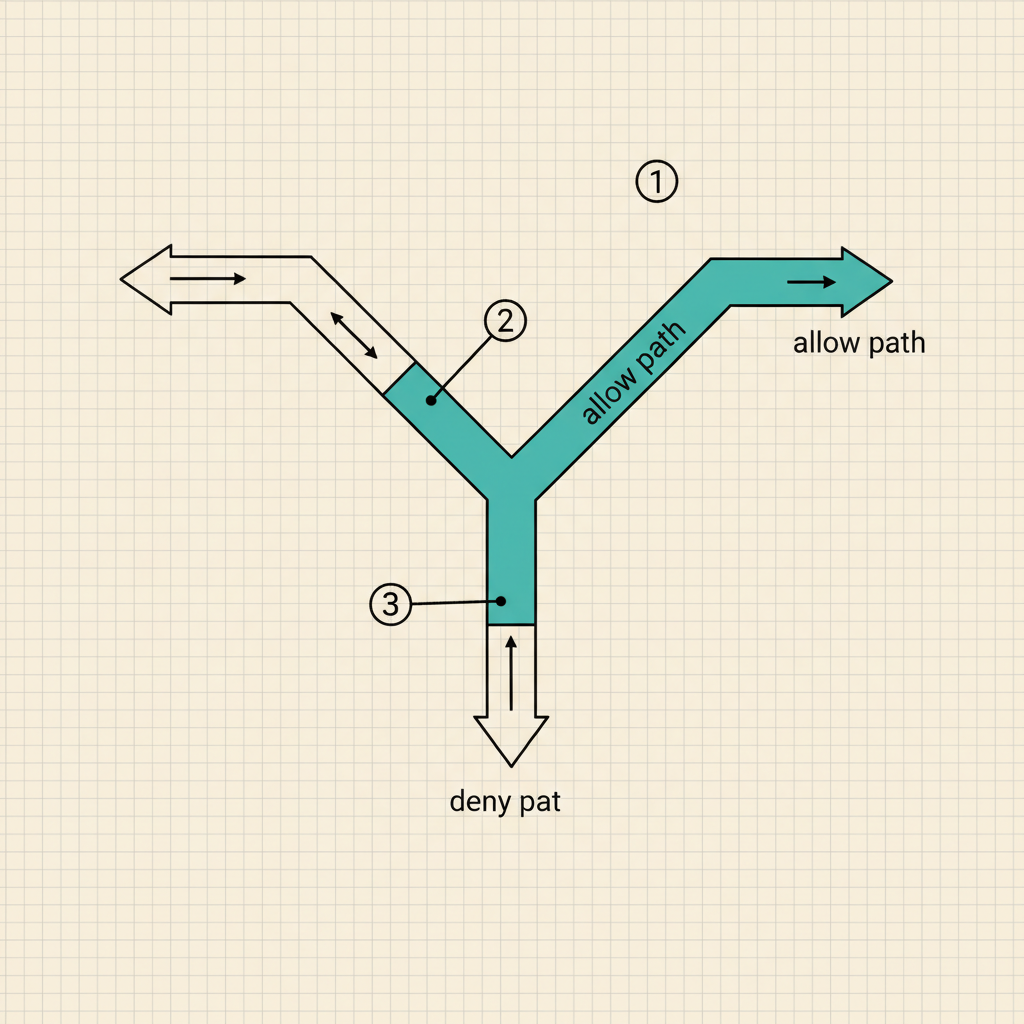
The OpenAI Agents SDK wraps a runner invocation in a trace and emits spans for model turns, agents, generations, function calls, guardrails and handoffs, plus audio work. That gives an engineering team a detailed execution map without building instrumentation for every step. I would still reject the phrase "audit complete" in a production review until the team proves export delivery and redaction behavior, plus caller attribution and evidence custody. A trace waterfall answers what the SDK observed. An audit record has to survive harder questions.
TL;DR
- OpenAI Agents SDK tracing is enabled by default, with automatic spans across the runner and its major operations.
- Generation and function spans can carry inputs and outputs; sensitive-data capture defaults to enabled.
- Batch export runs asynchronously, so shutdown and flush, plus queue pressure and exporter failure belong in acceptance testing.
- SDK traces need correlation with authenticated routed-request records when an audit must prove identity and policy decisions.
The SDK records an execution graph
OpenAI's tracing guide describes a trace as one workflow operation composed of spans. The default instrumentation wraps run and run_sync, plus run_streamed, then records task and turn spans. Agent activity, LLM generations, function calls, guardrails, handoffs, transcription, plus speech and related audio groups receive their own span types.
That structure is useful because one trace ID can connect a model generation to the guardrail and function activity around it. The tracing module reference also exposes trace and span identifiers, lifecycle callbacks, processors, exporters, plus flush and shutdown interfaces. These are the raw pieces of an evidence map.
Keep the map precise by treating SDK traces as activity observed inside the application runtime. OpenAI's Agents guide positions the SDK as the option for controlling the agent loop in your application, with application-owned storage and tool handlers among its runtime choices. OpenAI organization events and the visual Builder surface answer different administrative questions, covered in OpenAI Agent Builder audit logs. A security review should place those records on separate sheets rather than calling every OpenAI event an SDK audit log.
Sensitive data enters traces by default
The tracing guide says generation spans store LLM inputs and outputs, while function spans store function inputs and outputs. trace_include_sensitive_data defaults to True. Audio spans can also include base64-encoded PCM input and output under their separate setting. A support prompt containing a customer account number can therefore appear in the tracing path even when the production database treats that field as restricted.
I would put a pink sticky note on the first trace export that says, "This copy is another data store." Retention, access, deletion, region, plus incident handling now apply to it.
Set the capture policy deliberately. Disabling sensitive-data capture preserves event spans while omitting model and function payloads as documented. Then test the result with marked values in a non-production prompt and tool argument. Search the exported payload, tracing destination, error output, plus the dead-letter path. The Agents SDK prompt-injection guide covers guardrail placement. This acceptance test focuses on what the tracing path retains after those controls run.
Organizations using OpenAI APIs under Zero Data Retention face another boundary: the SDK documentation says tracing is unavailable under ZDR. Record that incompatibility in the deployment decision instead of assuming the default trace path remains available.
Export composition decides whether redaction can fail closed
The SDK provides two processor controls with materially different behavior. add_trace_processor() adds another observer while leaving the default OpenAI exporter registered. set_trace_processors() replaces the default processors. OpenAI's guide warns that processor callbacks are independent and that one processor's exception does not stop the others.
That means a redaction processor placed before an exporter creates ordering, not dependency. The exporter may still receive the original span after redaction fails. When delivery depends on successful redaction, the guide recommends one application-owned exporter that copies the serialized payload, redacts the copy, and sends only the redacted result. Failure during serialization or copying should discard the batch before transmission, as should redaction failure.
A committee may describe processor composition as implementation detail. I would block the release on it. Prove the failure path by forcing the redactor to throw on a marked generation span, then confirm that neither the destination nor the default exporter received the payload.
Buffered delivery needs destructive tests
The default BatchTraceProcessor exports in the background every few seconds or after its in-memory queue reaches a trigger. OpenAI documents flush_traces() for immediate delivery after a unit of work and a final flush when the process exits normally. Those behaviors improve delivery, but they do not establish durable custody.
Test ugly exits by completing one agent run, terminating the worker before the next scheduled batch, and comparing expected span IDs with received span IDs. Run the same sequence after flush_traces(), then fill the queue, break the destination, restore it, and inspect duplicates or gaps. Kill the container without a graceful shutdown and keep the processor configuration and timestamps beside the results.
The acceptance record should state expected spans, observed spans, export time, destination acknowledgment, missing identifiers, plus retry outcome. AI agent observability explains the operational value of traces. Audit acceptance adds completeness and custody tests that an attractive waterfall view cannot supply.
Identity and policy require a correlation record
A trace ID proves correlation inside the traced workflow. It does not, by itself, prove the verified human principal behind a run, the delegated agent identity, the policy version applied to a model route, or the reason a request was allowed. Attach those facts at the application boundary and carry a stable correlation identifier into the trace metadata.
For an authenticated HTTP model call, retain a separate record containing the originating identity, agent identity where applicable, model destination, prompt classification, policy version, decision, timestamp, and provider request identifier. The AI audit log schema provides a field-level starting point. Join that record to the SDK trace during the release test and retrieve both sides using one known request.
Local handoffs, function execution, MCP actions, application storage, and SDK memory remain under their respective owners. Their presence in a trace does not move them into an HTTP policy gateway's control boundary.
DeepInspect
DeepInspect applies when an authenticated user or agent sends an LLM HTTP request that the application deliberately routes through its proxy. It evaluates supplied identity and data context against a versioned policy, then records the allow, redact, or deny decision with a correlation identifier. That record can be joined to the SDK trace for the same model call.
The boundary stays narrow. DeepInspect does not inspect local SDK handoffs, function execution, MCP actions, application storage, tracing queues, or direct bypass traffic. The SDK records workflow behavior it observes. DeepInspect records policy decisions only for routed model HTTP traffic it sees.
Book a demo today.
Frequently asked questions
- Are OpenAI Agents SDK traces audit logs?
They are diagnostic evidence with useful identifiers and lifecycle detail. Their audit value depends on the deployment's identity binding, coverage, export delivery, integrity controls, retention, access, and custody. Treat the native trace as one evidence source and document the properties added around it.
- Does flush_traces prove complete delivery?
flush_traces()forces immediate export of buffered traces and spans through the configured processor path. It improves timing for workers and request handlers. Completeness still requires expected-versus-observed testing and destination acknowledgment, plus failure-path evidence.- Can a redaction processor safely sit before the default exporter?
Export that depends on redaction belongs inside one application-owned exporter, with the defaults replaced through
set_trace_processors().