Haystack Audit Logs: Separate Pipeline Diagnostics from Audit Evidence

Haystack provides Python logs, structured logs, LoggingTracer output, and traces for understanding pipeline execution. This guide separates those diagnostic records from immutable audit evidence, maps each source to the question it can answer, and defines a correlation test for authenticated LLM requests deliberately routed through an inspectable HTTP policy point.
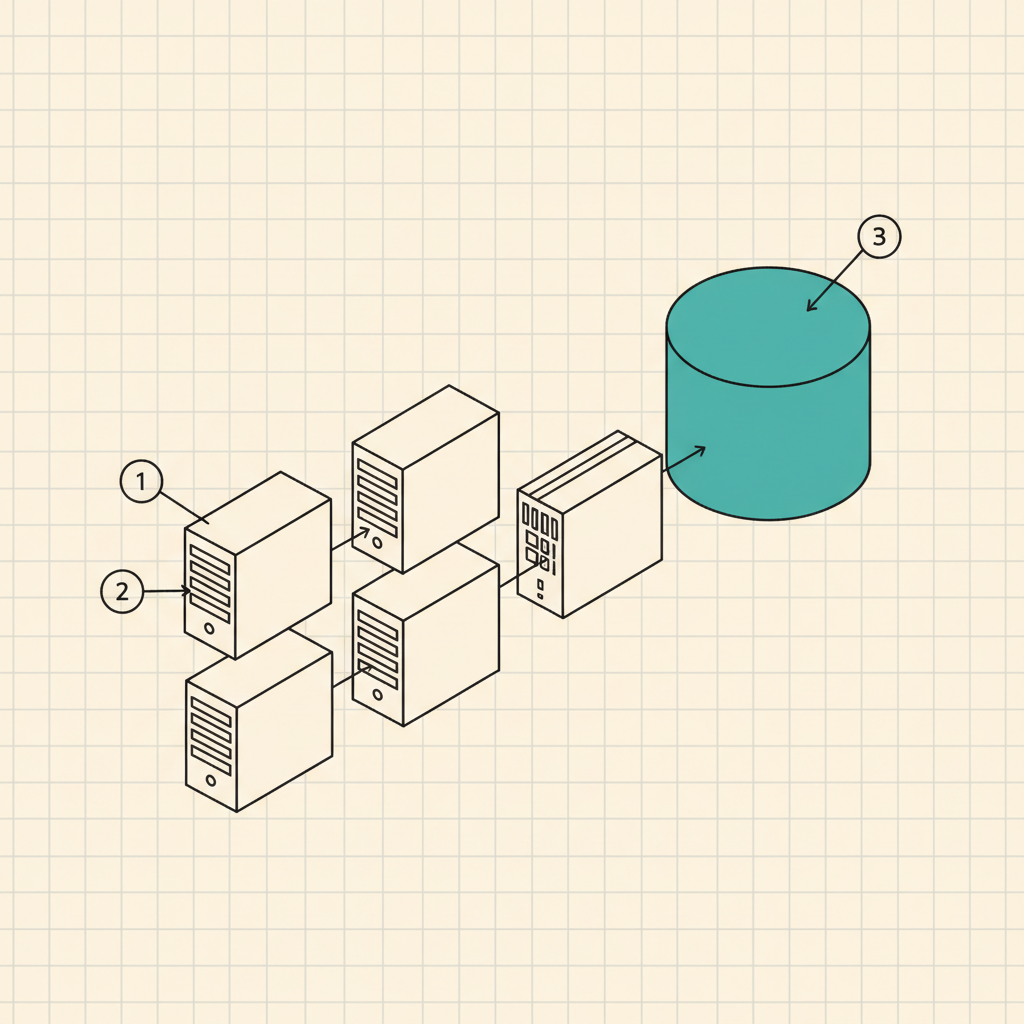
Haystack audit logs are an evidence-design problem before they are a logging configuration problem. Haystack can write Python logs, emit structured key-value records, show pipeline data through LoggingTracer, and send traces to supported backends. Those records help an engineer reconstruct execution. They do not become immutable audit evidence merely because they reached JSON storage or a trace viewer.
I would require a source map before approving a production pipeline. Put each record beside the question it can answer, its capture setting, its owner, and the identifier used to join it to the LLM request. A wall-mounted observability screen with green spans is useful during an incident. It still needs an independent decision record when the review asks who was allowed to send a particular prompt to a particular model.
TL;DR
- Haystack uses Python standard-library logging by default and can emit structured key-value records for log archives.
- Haystack traces document pipeline flow and timing; tracing and content capture require explicit enablement.
- Diagnostic logs and traces explain execution, but their documented features do not establish immutable audit evidence.
- Authenticated HTTP LLM calls need a separate policy decision record, joined to Haystack telemetry with stable identifiers.
Haystack audit logs start with four evidence sources
The Haystack logging documentation describes several sources rather than a single audit-log facility. Standard-library logging is the default, with WARNING as the default level. Teams can switch to INFO for more console detail. LoggingTracer exposes data moving through a pipeline without requiring a tracing backend, which the documentation positions for experimentation and prototyping.
Structured logging adds key-value metadata through structlog. Haystack limits its automatic formatting handler to its own logger namespaces, leaving the root logger and process-wide structlog configuration unchanged. The same page recommends JSON logging for production and says Haystack switches to JSON when it detects no interactive terminal.
Inventory these sources separately. Record the effective level, logger namespace, handler and propagation settings, renderer, collection destination, and retention owner. A production claim should point to retrieved records from that destination, not to a configuration snippet.
Traces answer execution and timing questions
Haystack's tracing documentation says traces document request flow through an application. They expose component execution order and help locate where a pipeline spends time. Haystack lists support for OpenTelemetry, MLflow, Datadog, Langfuse, Weights & Biases Weave, Rhesis, Arize products, and custom tracers, along with its own LoggingTracer.
That makes traces strong diagnostic evidence. A trace can show that a retriever ran before a generator, identify the component where latency accumulated, and preserve the span relationship exported to the selected backend. The wider AI agent observability model still applies: execution records need stable identifiers if an investigator must connect a model call to surrounding application activity.
Haystack never enables tracing automatically, according to the documentation. A deployment enables it through haystack.tracing.enable_tracing(...) or a tracing connector component. The evidence map should therefore record the tracer implementation and initialization path, plus exporter configuration, sampling behavior, and the backend query used to retrieve a known run.
Content tracing creates a sensitive diagnostic record
Haystack can include component input and output values in traces. The tracing page says content tracing is disabled by default to prevent sensitive user information from being sent to a tracing backend. Teams can enable it with the HAYSTACK_CONTENT_TRACING_ENABLED environment variable or in Python.
That setting changes the evidence store's contents. Inputs can include prompts and retrieved material. Outputs can include model responses. The security review should identify the approved backend, readers, retention period, and redaction path before content leaves the Haystack process. It should also record the effective setting rather than inferring it from the existence of ordinary spans.
I would reject a blanket rule that turns on content tracing in every environment. A targeted capture test proves far more: run a synthetic case, retrieve the expected values, confirm the access boundary, then disable or narrow collection according to the approved policy. Haystack's default protects against accidental export, so changing that default deserves a written owner and purpose.
Diagnostic traces are not immutable audit evidence
The two Haystack pages document monitoring, debugging, execution order, timing, log formatting, and export options. They do not describe an immutability guarantee, cryptographic signing, write-path independence, or a fixed retention commitment for the resulting records. A JSON log line can still be rotated. A trace backend can apply sampling or access rules. An application operator may control the same configuration that decides which events exist.
Use precise labels in the evidence map. Call Python and structured records application logs. Call exported spans diagnostic traces. Reserve immutable audit evidence for a separately governed record whose storage and integrity properties actually support that term. DeepInspect's preferred product claim is narrower: a signed, tamper-evident per-decision record with write-path independence, as described in the guide to signed audit logs for AI requests.
This distinction prevents a trace screenshot from carrying a claim its source cannot support. The trace explains pipeline execution. The independent record explains the request-policy decision made on a controlled route.
The evidence map assigns one question to each record
A useful map fits on one review page. I would include these entries:
- Python application log: Which Haystack warning or information event did the configured logger emit, under which namespace and level?
- Structured log: Which key-value fields reached the production log archive, and which handler and propagation settings produced them?
- LoggingTracer output: Which component inputs and outputs appeared during the inspected run without a separate tracing backend?
- Exported trace: Which components ran, in what order, with which span relationships and observed timing?
- Content trace: Which approved inputs and outputs were captured after explicit content-tracing enablement?
- Provider record: Which request reached the configured LLM provider account, model, and project under the provider's own identifier?
- Independent route decision: Which authenticated caller requested the HTTP LLM operation, which destination and policy version were evaluated, and what outcome was recorded?
Give every entry an owner, storage destination, access group, retention rule, clock source, collection query, and known gap. Keep native Haystack identifiers as well as the application run and model-call identifiers. Renaming every record to audit_event makes the schema look tidy while erasing the custody boundary an investigator needs.
A correlation drill proves the design
Create one synthetic pipeline run with a unique case identifier. Make it execute two components before one LLM invocation. Enable the approved tracer and retrieve the exported trace from its actual backend. Retrieve the relevant Python or structured logs from the production archive. Confirm that the expected component order and identifiers survived collection.
For a pipeline that invokes an LLM over an inspectable HTTP route, carry a stable application run identifier and a separate model-call identifier into the route decision record. Preserve the provider request identifier when the provider returns one. Then retrieve all three views: Haystack execution telemetry, the route-policy decision, and provider evidence. The timestamps should fall within the deployment's documented clock tolerance.
Repeat the drill with content tracing disabled. Ordinary spans should remain available while sensitive component values stay absent. Repeat it once more with a controlled exporter failure and verify that the owned alert or health check reports the delivery gap. I would block release when the team can generate a local trace but cannot retrieve the corresponding record from the evidence system named in its procedure.
DeepInspect
DeepInspect applies only when an authenticated caller's Haystack pipeline invokes an LLM over an inspectable HTTP route deliberately sent through the proxy. The application supplies caller and correlation context. DeepInspect evaluates the model destination, data classification, and versioned policy before forwarding an allowed request, then writes a signed, tamper-evident per-decision record for that routed operation.
Haystack pipeline components, local logs, diagnostic traces, retrievers, document stores, and tracing backends remain outside that enforcement boundary. Direct model calls that bypass the configured route also sit outside the DeepInspect record. Correlation joins the Haystack execution view to the independent route decision without pretending either system observed the whole pipeline.
Book a technical deep dive at deepinspect.ai.
Frequently asked questions
- Does Haystack provide one immutable audit log?
The cited Haystack documentation describes standard Python logs, structured logs,
LoggingTracer, and several tracing integrations. Each source has different configuration and collection behavior. The pages do not document a single immutable audit-log facility. Build a source map that states what each record proves, then add separately governed evidence for any request-policy decision that needs integrity and independent custody.- Is `LoggingTracer` suitable for production audit evidence?
Haystack presents
LoggingTraceras a way to inspect data moving through a pipeline without setting up a tracing backend, especially during experimentation and prototyping. Its output can help diagnose a run. An audit design still needs the destination, retention, access, integrity, and failure behavior required by the review. The documented tracer feature alone does not supply those properties.- Does Haystack record prompt content by default?
Content tracing is disabled by default. Haystack documents explicit enablement through
HAYSTACK_CONTENT_TRACING_ENABLEDor Python. Standard logs and third-party integrations have their own configuration, so review the effective deployment rather than assuming every record contains the same fields. Treat captured inputs and outputs as sensitive material and approve their destination before enabling content capture.- What identifiers should connect Haystack and route evidence?
Use a stable application run identifier for the pipeline and a distinct model-call identifier for each LLM operation. Keep the trace and span identifiers produced by the tracer. Add the route decision identifier and provider request identifier where available. Record attempts separately if the client retries. The resulting chain preserves each system's native record while supporting one investigation.