AI gateway observability: the metrics, traces, and logs a policy decision point should emit
An AI gateway emits four signal categories that serve four different audiences. Per-decision audit logs serve the regulator under EU AI Act Article 12. Per-request traces serve the engineering team debugging a request. Per-policy metrics serve the operations team measuring policy effects. Per-model latency histograms serve the capacity-planning team sizing the LLM provider relationship. OpenTelemetry alignment lets the four signal categories share a transport without conflating their consumers.
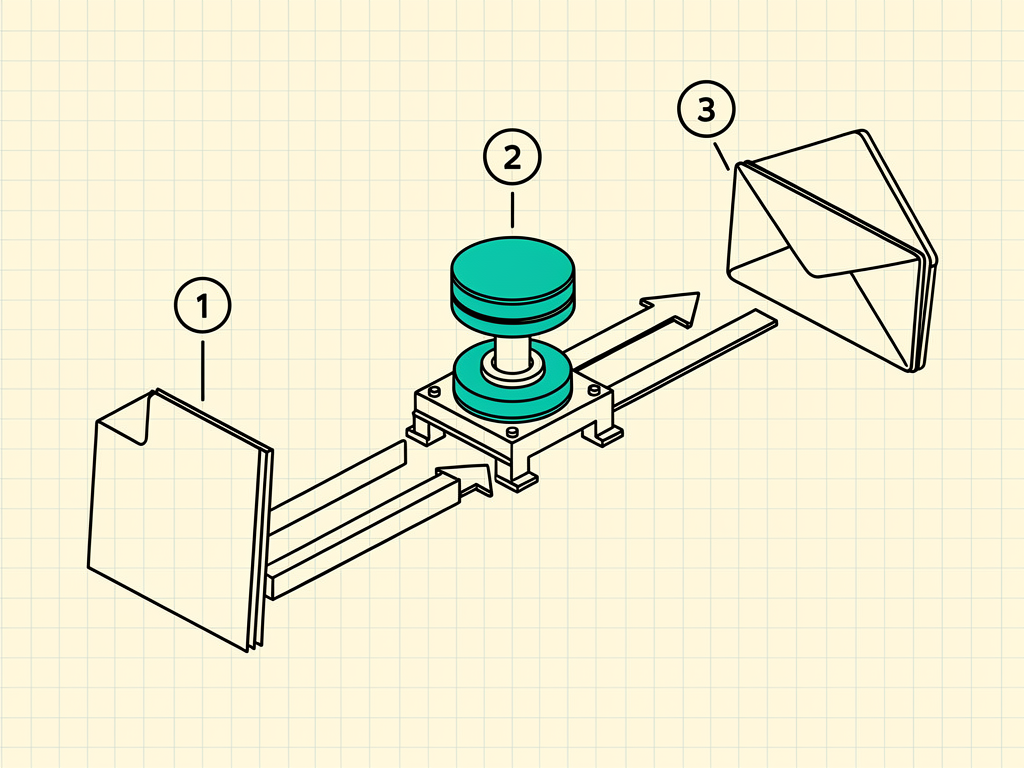
An AI gateway sits in the request path between the calling application and the LLM provider. The gateway sees every request, every identity, every policy decision, and every model response. The gateway is therefore the single point in the AI architecture where the four observability signal categories converge: per-decision audit logs for the regulator, per-request traces for the engineering team, per-policy metrics for the operations team, and per-model latency histograms for the capacity-planning team. The four audiences read four different views of the same underlying events. EU AI Act Article 12 sets the baseline for the audit log category. OpenTelemetry is the transport that carries the other three without conflating them with the regulatory record.
I want to walk through the four signal categories the gateway emits, the OpenTelemetry span attributes a policy decision should carry, the metric and histogram shapes that match operations and capacity-planning consumers, and the separation that keeps the regulatory record independent of the engineering telemetry.
Per-decision audit logs
The per-decision audit log is the regulator's view. The log records every policy decision the gateway makes, with the verified identity, the role context, the data classification, the model called, the policy version that governed the decision, the decision outcome (pass, redact, block), and a cryptographic signature that prevents post-hoc modification. The record is committed before the LLM response returns, satisfying the contemporaneous record requirement of EU AI Act Article 12. The destination is the customer's audit sink: an S3 bucket with object-lock, a Splunk index with retention configured to the regulatory window, or a Snowflake table with row-level append-only enforcement. The log is not engineering telemetry; the consumer is the auditor, the legal team, and the data protection officer. The retention is the regulatory minimum (Article 26 reads to 10 years for high-risk systems).
Per-request traces
The per-request trace is the engineering view. The trace follows a single request from the calling application through the gateway's policy stages to the LLM provider and back. The OpenTelemetry span attributes for the policy decision stage carry the identity, the policy evaluation latency, the decision outcome, and the policy version. An example span:
The trace is for the engineer debugging a specific request: why did this request take 1.2 seconds, where in the policy stack did latency accumulate, which upstream model handled the call. The trace destination is the engineering APM (Datadog, Honeycomb, Grafana Tempo). The retention is the engineering window, typically 7 to 30 days.
Per-policy metrics
The per-policy metric is the operations view. The metric counts decisions per policy version per outcome over time. The shape is a Prometheus counter with the policy version, the decision outcome, and the data classification as labels:
The metric answers the operations question: how often does the current policy block, how much does that change after a policy rollout, which route accumulates the highest block rate, which classification correlates with the most denials. The metric destination is the operations dashboard (Grafana, Datadog Dashboards). The retention is the operations window, typically 90 days to 13 months for year-over-year comparisons. The metric is aggregated, not per-request: it does not carry the identity or the prompt content, which keeps it outside the data classification that the audit log carries.
Per-model latency histograms
The per-model latency histogram is the capacity-planning view. The histogram records the upstream model latency distribution per provider, per model, per route. The shape is a Prometheus histogram with bucketing tuned to the LLM latency profile:
The histogram answers the capacity-planning question: what is the p50, p95, and p99 latency for each model the gateway routes to, how does the latency change with prompt length, which provider degrades during regional events, where to invest in fallback routing. The destination is the capacity-planning dashboard, separate from the operations dashboard because the audience and the time horizon differ (capacity planning thinks in quarters; operations thinks in shifts). The histogram is also aggregated, with no identity or prompt content.
How OpenTelemetry separates the four categories
OpenTelemetry handles three of the four categories: traces through the trace SDK, metrics through the metrics SDK, and logs through the logs SDK. The audit log category is the fourth, and the architectural separation matters. The audit log goes to a destination the customer controls, with write-once durability and cryptographic signature; the OTel logs pipeline goes to the engineering log destination, with engineering retention. The separation prevents the engineering log pipeline outage from breaking the regulatory record, and prevents the audit retention requirements from inflating engineering log storage cost. The gateway emits to both pipelines from the same in-process event, with the audit commit on the critical path of the request (fail-closed if the audit sink is unreachable) and the engineering telemetry on a non-blocking path.
DeepInspect
DeepInspect emits the four signal categories from the policy decision point. The per-decision audit log is committed to the customer's audit sink before the LLM response returns, with cryptographic signature and write-once durability. The per-request trace is exported through the OpenTelemetry trace SDK with the span attributes shown above, configurable to any OTLP-compatible engineering APM. The per-policy metric is exposed on a Prometheus scrape endpoint with the policy version, decision outcome, and classification labels. The per-model latency histogram is exposed on the same scrape endpoint with the provider, model, and route labels. The four pipelines are independent: an outage of the engineering APM does not affect the audit commit, and an outage of the audit sink triggers the fail-closed deny path.
The architectural separation produces the property the regulator expects (the audit record is independent of the application and independent of the engineering telemetry) and the property the engineering team expects (the trace, the metric, and the histogram are first-class OpenTelemetry signals that integrate with the existing observability stack).
Let's talk today.
Frequently asked questions
- What span attributes are required versus optional for an AI policy decision?
The required attributes are the identity subject, the policy version, the decision outcome, the data classification, and the model name. The required set lets the engineering team correlate a trace with the audit record and reconstruct the decision context. The optional attributes are the identity role (helpful for role-based queries), the policy evaluation latency (useful for policy performance tuning), the upstream provider (useful for multi-provider routing), and the prompt token count (useful for cost attribution). The OpenTelemetry semantic conventions for generative AI, ratified in version 1.30 in March 2026, define the canonical attribute names; the gateway should follow the conventions to maximize tool interoperability.
- Should the audit log and the OTel log pipeline share a transport?
No. The audit log requires write-once durability, cryptographic signature, and regulatory retention. The OTel log pipeline is engineering telemetry with engineering retention. Sharing the transport conflates the two requirements and produces either inflated engineering log cost or insufficient audit durability. The architectural pattern is two pipelines: the audit pipeline goes directly to the customer audit sink with the fail-closed precondition; the OTel pipeline goes to the engineering destination on a non-blocking path. The two pipelines emit from the same in-process event but commit to independent destinations.
- How do I reconcile the audit log with the OTel trace for a specific request?
The reconciliation key is the request ID. The gateway generates a request ID at request entry, attaches it to the audit record, attaches it to the OTel trace as the trace ID or as a custom attribute, and returns it in the response header. The engineering team uses the request ID to pull the OTel trace; the audit team uses the same request ID to pull the audit record. The reconciliation works backward from either pipeline. The shared key is the only metadata the audit log and the OTel pipeline share; the identity, classification, and policy version live in both records independently.
- What cardinality limits apply to the per-policy metrics?
Prometheus practical limits put metric cardinality at roughly 10 million active series per server. The per-policy metric with policy version, decision outcome, classification, and route as labels produces cardinality of (policies x outcomes x classifications x routes). For a typical enterprise deployment (10 active policies, 3 outcomes, 5 classifications, 20 routes), the cardinality is 3,000 series, well within limits. The identity is deliberately not a metric label because per-user cardinality breaks the metric pipeline; per-user analysis goes through the audit log query path, not the metric path.
- Does the histogram need to be per-model or can it be per-provider?
Per-model. Different models from the same provider have different latency profiles (GPT-4o versus GPT-4o-mini, Claude 3.5 Sonnet versus Claude 3 Haiku). The capacity-planning team needs the per-model histogram to size provider commitments and to model fallback routing decisions. The per-provider aggregate is computable from the per-model series at query time, so the storage cost is paid once and the analysis flexibility is preserved.